Profiling Turbopack
On macOS
Install cargo-instruments (opens in a new tab)
cargo-instruments (opens in a new tab) version 0.4.7 is incompatible with our workspace setup, so to install it you'll need to clone it and install it from an updated branch:
git clone https://github.com/cmyr/cargo-instruments.git
git checkout update-deps
cargo install --path .
Make sure you have all the prerequisites (opens in a new tab) for running cargo-instruments.
Run the profiler
By default, the next-dev CLI will keep watching for changes to your application and never exit until you manually interrupt it. However, cargo-instruments (opens in a new tab) waits for your program to exit before building and opening the trace file. For this purpose, we've added a profile feature to next-dev which exits the program if no updates are detected within a given timeframe and there are no pending tasks.
To profile next-dev, run the following command:
cargo instruments -t time --bin next-dev --release --features profile [-- [...args]]You can also run other templates (opens in a new tab) than the time profiler.
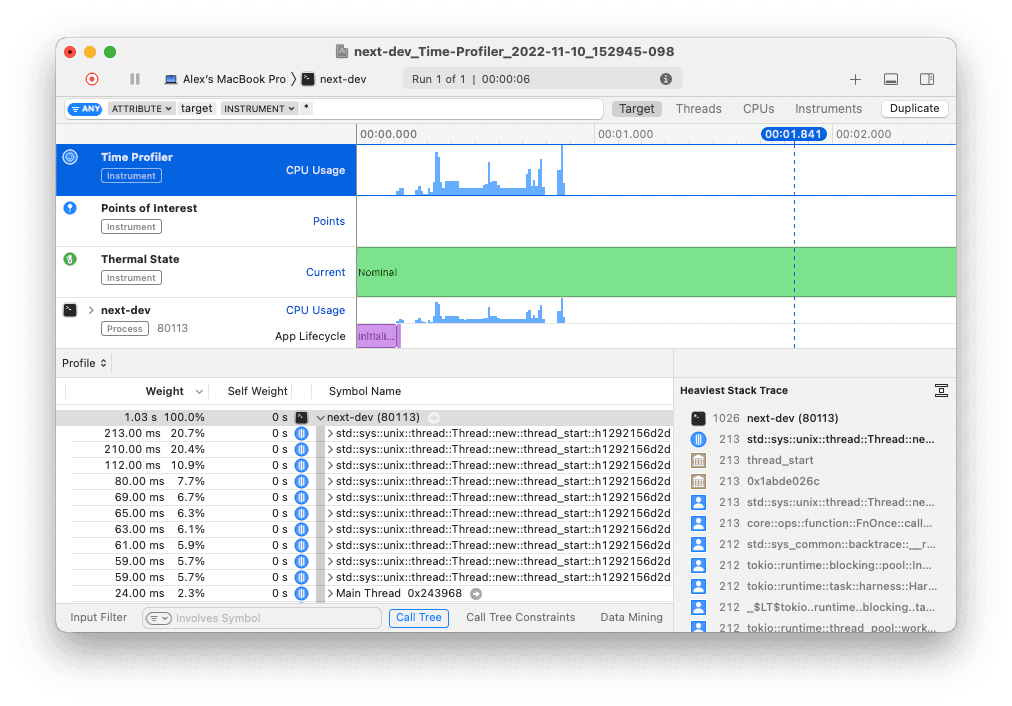
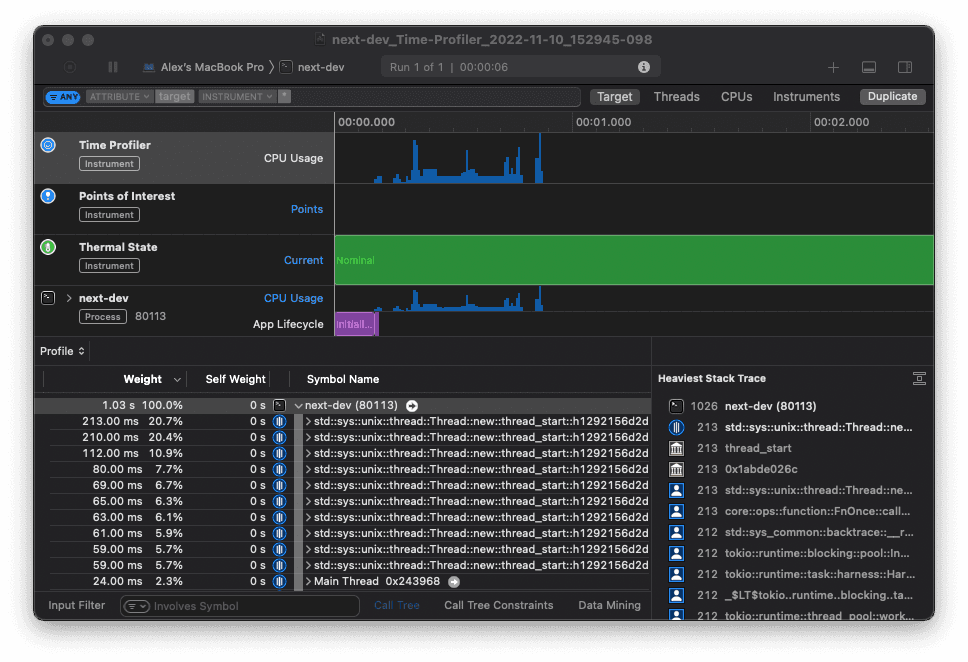
Once the program exits, the profiler will open the trace file in Instruments. Refer to the learning resources (opens in a new tab) to learn how to use Instruments.
Linux
Memory usage
# Install `heaptrack` and `heaptrack_gui`
sudo apt install heaptrack heaptrack_gui

# Compile with debug info but without the alternative allocator:
CARGO_PROFILE_RELEASE_DEBUG=1 cargo build --bin next-dev --release --no-default-features --features cli

# Run the binary with heaptrack (it will be much slower than usual)
heaptrack target/release/next-dev [...]

# Stop it anytime

# Open the GUI and open the heaptrack.next-dev.XXX.gz file
heaptrack_gui
On other platforms
We currently don't have a guide for profiling Turbopack on other platforms.